Decisions are only as strong as the data that supports them. At Intellistack Systems, we organize scattered business information into streamlined analytics views and design custom dashboards for cross-departmental use. By focusing on data integrity and user-friendly reporting, we simplify the digital landscape, allowing leadership to focus on strategic growth rather than manual data management.

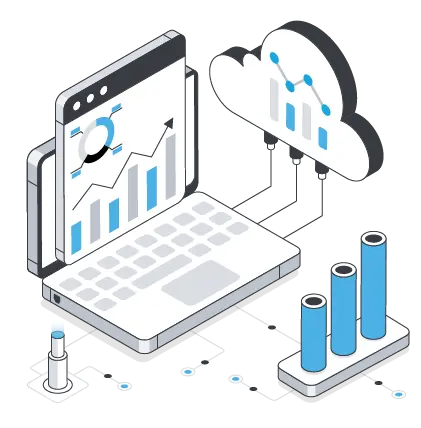
Create interactive dashboards that track KPIs, sales, operations, finance, customer trends, and team performance in one clear view.
Build reliable data pipelines that collect, clean, transform, and move data from multiple systems into usable reporting environments.
Move away from outdated reporting methods, manual spreadsheets, and disconnected databases with cleaner data platforms and workflows.
Improve data accuracy, ownership, access control, reporting consistency, and compliance through structured data management practices.
The journey toward better insights begins by identifying which data points truly drive value. By mapping out sources and user needs, we establish a strategy that aligns every metric with the broader goals of business reporting and leadership.
Fragmented tools, including CRMs, ERPs, and cloud databases, are woven into a single, unified reporting flow. Through seamless connectivity, we eliminate technical silos, ensuring that information moves freely across the organization without manual intervention.
We remove the burden of manual report preparation by implementing automated dashboards and scheduled refreshes. By shifting away from repetitive data entry, we give our team the time they need to focus on high-impact analysis rather than administrative tasks.
Structured datasets are meticulously prepared to support everything from forecasting to AI use cases. When data is organized with this level of precision, a foundation is created that allows for sophisticated management reporting and deep operational insights.
It includes data strategy, data integration, data engineering, dashboard development, BI reporting, data quality improvement, governance, analytics setup, and ongoing support.
Yes. We can connect data from CRMs, ERPs, accounting tools, marketing platforms, cloud databases, spreadsheets, and custom business applications.
Dashboards help teams track KPIs, spot trends, monitor performance, compare departments, and make faster decisions without waiting for manual reports.
Yes. We support data cleansing, deduplication, validation, standardization, mapping, and data model preparation for reporting and analytics.
Yes. We can support cloud-based data environments, data warehouses, data lakes, reporting tools, and modern BI platforms based on business needs.
Yes. We provide dashboard updates, data pipeline monitoring, report changes, performance tuning, issue fixing, documentation, and ongoing analytics support.